Drones can now provide a wide variety of data types, everything from a few basic photos through to complex measurable 3D models with annotations and overlays.
Below we list and explain some of the most common types, and will continue to update this page over time as new capabilities and data formats emerge. Most of these weren’t available when we started the business, so we look forward to all the amazing new things we will be able to supply in another 5 years.
The list is organised approximately in order of complexity: even the 10 year old kid next door can take basic aerial photos with a drone these days, so that is clearly at the top of the list. However, we wouldn’t ask him to provide data analysis for survival counts on plantation forestry surveys or be able to present stockpile volume measurements in a secure online data portal, and it is at this end of the scale where you can really start to see value from drone data, and that is where we specialise at AUAV.
General Aerial Photography and Video
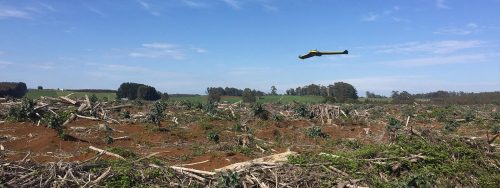
Aerial Photography involves taking photos or video of an area of interest from the air. We don’t typically undertake much aerial photo work for its own sake (e.g. Real Estate or Film productions), but we will often include some when we are on site mapping, surveying or inspecting.
Clients like an overview shot of their project or site for internal or external promotion, and we like to be able to provide this as a bonus.
Aerial Photography is usually delivered as JPG images, edited to look their best. Aerial Video delivery formats are most often Quicktime (MOV) or MPEG (MPG).
360 Interactive Panoramas
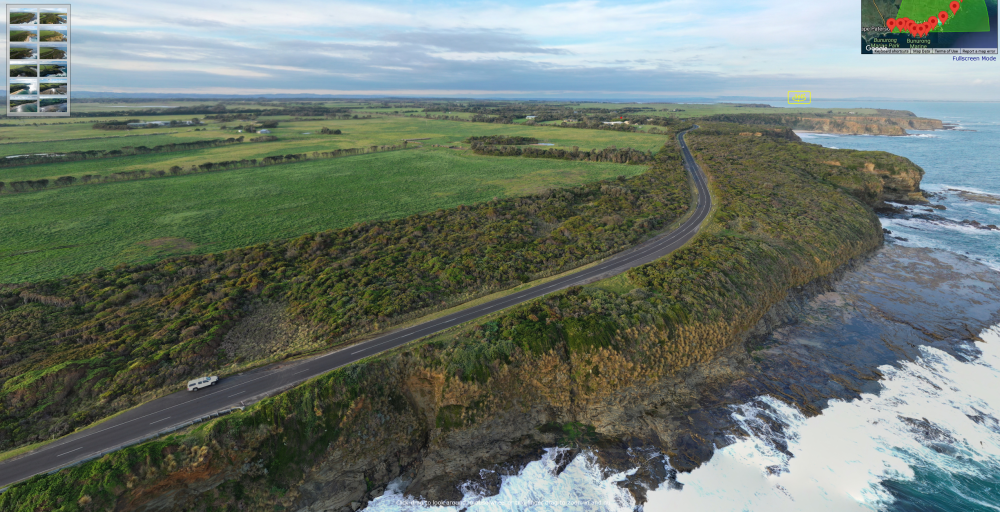
Aerial Photography gets a lot more useful if you can put the person viewing it in the driver’s seat, and a great way of doing that is with an interactive 360 panorama.
This allows the viewer to look in any direction and zoom in on any details of interest. This can enable staff or stakeholders to explore a site for themselves, and typical uses include site safety inductions, site overview for management, or inspection for compliance issues or illegal dumping. We can also show the view from a building or other structure which has not yet been constructed, e.g. the outlook from each floor of a planned high-rise development.
It is also possible to produce multi-site panoramas, allowing you to jump between a series of linked locations. Many of our clients prefer this as a delivery format for long linear inspections, for example roads and pipeline routes, whereby we can capture a pano every 100m or so and provide them a complete overview they can interact with.
We can supply 360 panoramas as very-high resolution (15k+) JPG images, lat-lon images for use in VR/game engine backgrounds, or with our own online viewer. And like any normal image, they can also be overlaid with graphics to define shaded areas, boundary lines or any other annotations required.
View, zoom and pan around this example 360 panorama site.
Asset/Infrastructure Inspection Imagery and Reports
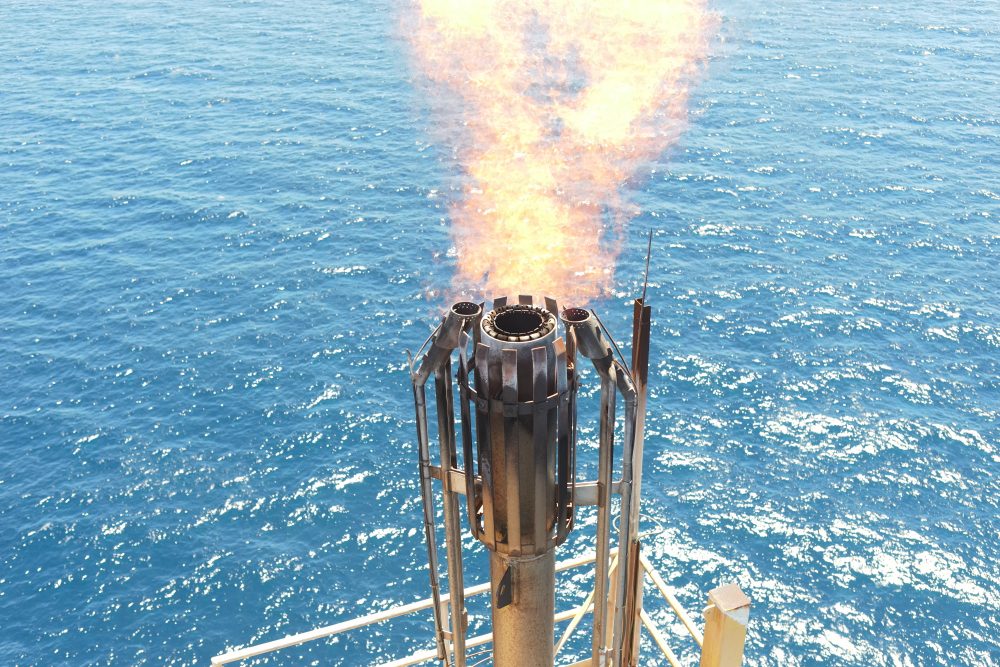
Although it may seem similar to general Aerial Photography, taking highly-technical and specific photos for the purpose of inspecting assets or infrastructure by drone is a lot more complex.
This work usually involves flying in close proximity to the structure being inspected, and also using zoom cameras to resolve fine details. It often requires flying in RF (Radio Frequency) or EM (Electromagnetic) interference, and the pilot should also have engineering or domain knowledge of the structure to know what to look for.
One specialist case involves using drones for inspection inside tanks, pipes, and other confined spaces. This requires a caged drone which is able to bump into things without causing damage, and also having on-board lighting. This technique avoids putting people into confined spaces, and avoids the complex scaffolding and rigging required for these inspections.
High-res geo-referenced images are typically provided in JPG format, though in many cases it is also possible for us to provide a detailed PDF report from a qualified inspector, rather than having the client look through all the images themselves. Alternatively, the imagery can be presented in an Online Data Platform (see below) which allows all stakeholders to easily view and make annotation notes directly onto the images for everyone to see and comment further on.
Orthomosaic Map
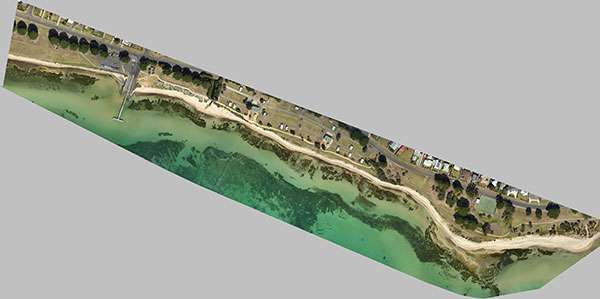
An ‘ortho map’ is aerial imagery which has been processed in a special way to appear like a map, i.e. from a perfect top-down viewpoint, and from which measurements can be taken.
Google Maps has made the concept of ortho imagery familiar to everyone around the world (though in their case it is not always perfectly top-down imagery, or very accurate!). The ortho maps produced from our drone data are typically accurate to either mapping grade accuracy (i.e. 1-3m) or survey grade accuracy (~5cm), and at a detail level of 3.5cm, which means you can see an individual golf ball or matchbox if you know where to look. Higher resolutions and higher accuracies are possible too, down to 1mm per pixel, though the time required (and therefore the cost) rises quickly.
Typical formats for ortho map images are GeoTIFF, ECW, JPG or large format PDF files for making laminated site office wall maps. We can also provide Google Earth and Google Maps tilesets, and just about any other format required.
Digital Elevation Model (DEM)
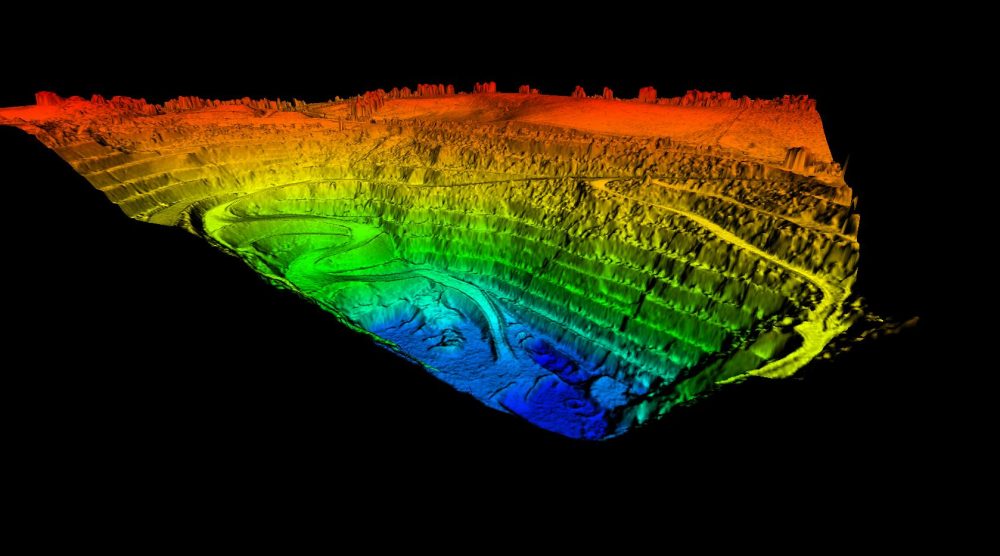
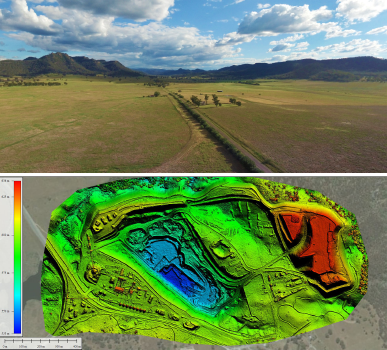
A Digital Elevation Model (DEM) is a 3D survey model of the terrain, with accurate X/Y/Z values representing the real world topography of an area. A Digital Terrain Model (DTM) is similar, but has been processed to remove any trees, buildings, etc to leave only the bare terrain. The term Digital Surface Model (DSM) is also sometimes used, to mean either DEM or DTM.
If captured and processed via a careful process to ensure accuracy, a DEM can then be used for a wide variety of tasks from calculating cut and fill for earthworks, stockpile volumes, landfill airspace volumes, slope gradients, flood/hydro modelling, engineering and architectural design, and much more. Elevation profiles and cross sections can be easily generated from this data, as well as contours, breaklines, etc (see below).
Typical formats for DEM elevation data is GeoTIFF raster or a grid of DWG/DXF/XYZ points or 12D TINs. These files can contain the full resolution (typically 3.5cm sampling) or be reduced to suit your needs (e.g. a 1m grid).
Elevation Contours
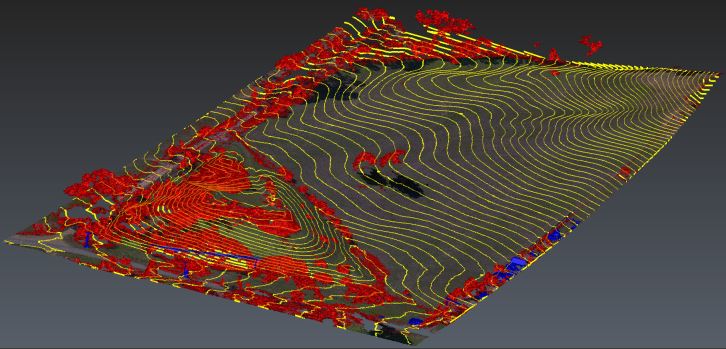
A Digital Elevation Model is usually the best way of viewing and calculating from a 3D terrain model these days, but it can be difficult to view in 2D, or in older software.
Contours are the traditional way of representing elevation data on a two-dimensional map, and they are still useful in this context. For example, we can overlay contours on top of a PDF ortho map, and some clients still request contours as a means of making their 3D datasets more easily viewed.
Typical formats for supplying contours are DXF or DWG files, and we can easily produce a range of spacings (e.g. 1m, 0.5m, 0.1m contours).
Drawings/Plots/Overlays/Breaklines
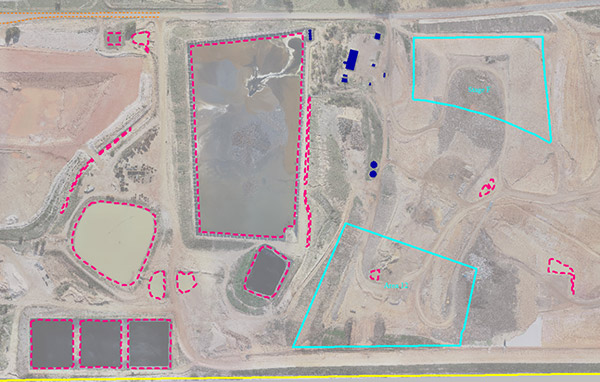
Contours as shown above are one form of a 3D line drawing which can be viewed along with aerial maps. We can also produce other point and line plots to represent classified features (e.g. buildings, fences, roads, etc) as well as overlaying breaklines and other strings, site boundaries, quarry/mine plans, subdivision plans, etc.
These features can be provided as independent files (typically DXF, DWG or KML format), or overlaid on top of our ortho maps or elevation data.
In some cases we are provided with data from our clients to overlay, or our draftspeople can classify and annotate these features directly from our aerial surveys.
3D Pointcloud Model
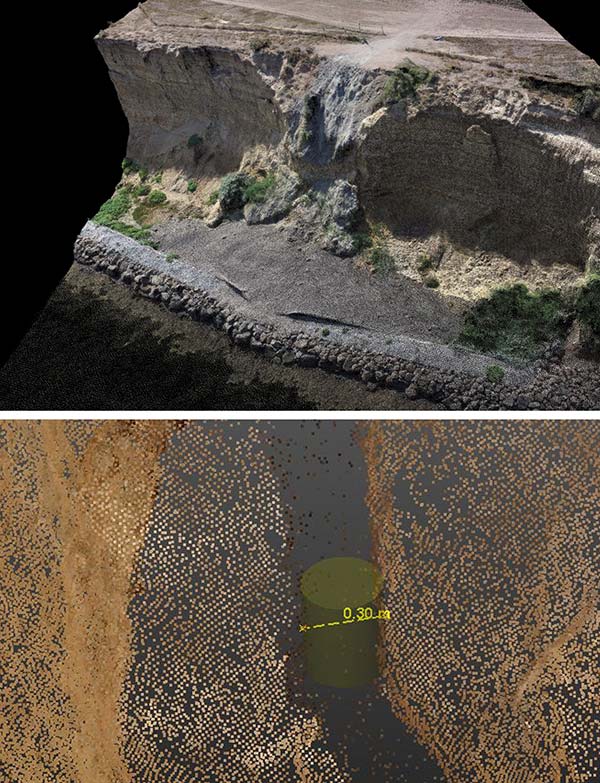
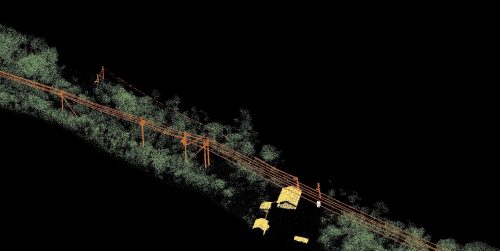
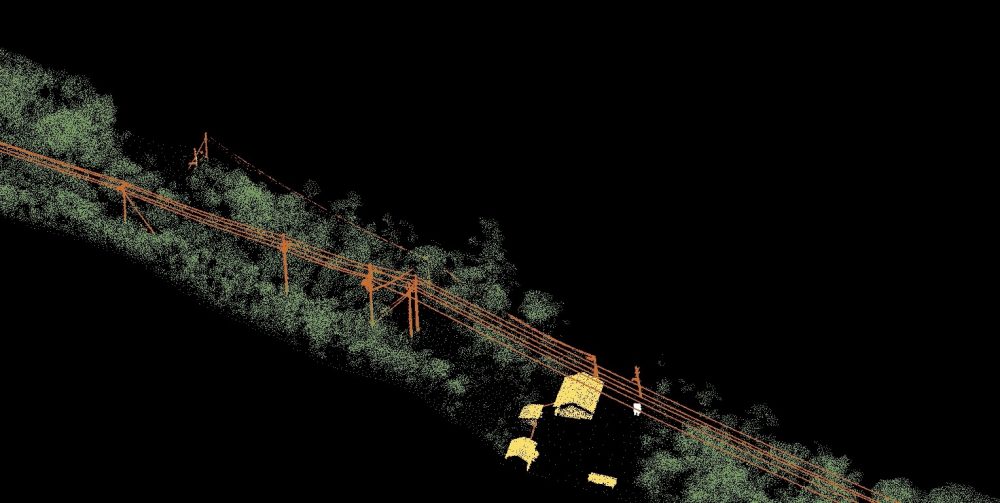
A 3D point cloud is similar to a grid of elevation points, but the difference is usually that the points contain colour information, and also that they can describe vertical surfaces too, i.e. they are true 3D spatial information rather than the 2.5D of elevation data which cannot accurately describe vertical or overhanging features.
If you want to sample and model a complex 3D environment (e.g. a rail corridor, a complete building, or coastal cliffs) then a pointcloud is a good representation. It allows you to zoom in and out and tumble around a complex 3D dataset. In a wider view these look like a complete 3D surface model, but if you zoom in too far you will see that it is not solid, but made up of many individual sample points. Being a 3D dataset, you can take all sorts of measurements between the points.
3D point clouds can be produced from either a LiDAR sensor or photogrammetry. There are pros and cons to each approach as we describe here, but the end result is similar (though in many cases the LiDAR will only show elevation, not the true colour of the scanned area).
Typical formats for 3D pointclouds are LAS or LAZ (LAZ is just a zipped/compressed LAS, there is no loss of data but produces a much smaller file). This is a standard format for reading into CAD, GIS and BIM software.
Multispectral/Hyperspectral Imagery and Mapping
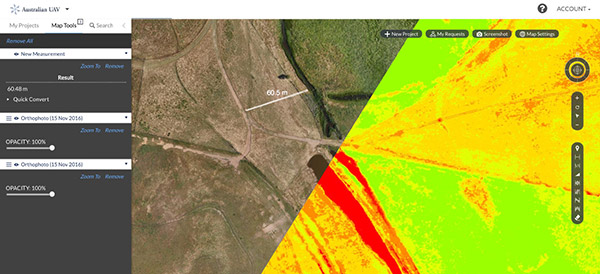
A normal camera captures visible light in RGB (Red, Green, Blue) channels to produce an image similar to your own vision.
With Multispectral cameras it is possible to also produce imagery containing other specific light bands, which often see into the infrared part of the spectrum (which human eyes cannot detect). This allows for complex analysis of vegetation (e.g. NDVI crop health index), or species classification as quite often the plants of interest will show up more clearly in one of these bands. A Hyperspectral camera captures an almost continuous section of the spectrum, allowing you to choose after capture which bands are most useful to you, but these are very expensive and not as practical to use at this point.
The outputs from multi-spectral imagery are typically provided as ortho images, or fed into data analytics solutions (see below) to find specific species, minerals, or report on the condition of certain materials. On the right you can see a split view between RGB and NDVI multi-spectral imagery of an agricultural site.
Thermal Imagery and Mapping
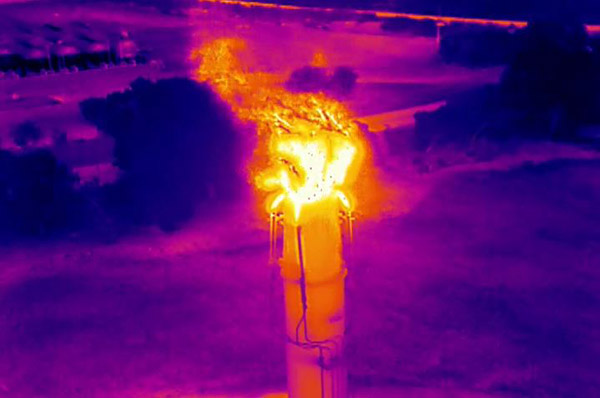
Similar to Multispectral imagery above, thermal sensors allow drones to capture bands of imagery that the human eye cannot detect, in this case representing temperature.
Many defects of assets and infrastructure will show up first in thermal imagery, so you can catch issues earlier. It is also very useful to create thermal maps of large areas for applications such as fire spotting, animal spotting, building insulation analysis, landfill underground hotspots as well as frost and vegetation analysis.
Thermal imagery can be provided as individual photos on TIF or Radiometric JPG format, video files, or orthomosaic maps showing temperature instead of colour.
GAS/AIR and Water Sampling
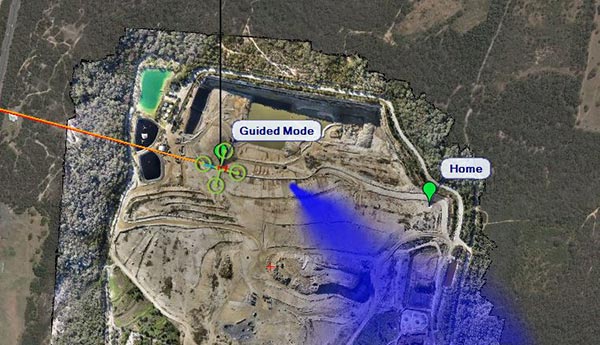
While most drone data is image-based, there is increasing demand for sampling air, gas and water by drone.
Small and lightweight gas sensors are evolving quickly, allowing for specific gases or a wider range to be sensed in real-time from the drone and the results transmitted live to the ground station (as well as stored for later analysis). In this way not only ground-level spot sampling but 3D plume modelling is now possible.
Unless a specific test is needed to be done in situ (e.g dissolved oxygen), water and other liquid sampling is usually done by collecting a physical sample from a remote location and bringing it back for analysis. In this manner samples can now be taken quite safely from locations which would be difficult or dangerous to access, including toxic dams on mine sites.
3D Mesh Models and Reality Capture
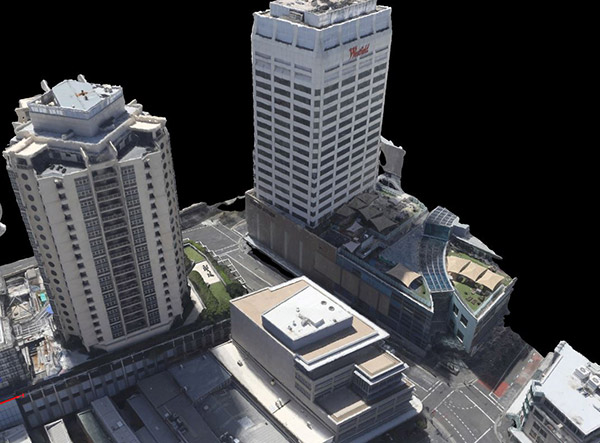
The ability to create full and accurate 3D models from aerial photography has come a long way in recent years, and we can now produce quite clean and crisp models, showing an incredible level of detail.
This technique is often referred to as Reality Capture (or Reality Mesh), meaning we can capture an asset, site, or even an entire city and present it in a way which allows the viewer to see that location as if they were there themselves (i.e. take a virtual site visit). Measurements and coordinates can be taken easily from these models simply by clicking between points. Unlike pointclouds, 3D mesh models are solid surfaces, and can contain a lot more visual information while using less data.
3D models can be provided in various file formats such as FBX, OBJ, 3MX and ESRI i3s. Alternatively, Online Data Platforms (see below) allow these data-heavy formats to be simply viewed online in a standard web browser, streaming only the details required, which makes them much more accessible.
Below you can see a short demonstration video showing 3D models of sites at 3 scales and levels of detail.
Custom Data Analytics
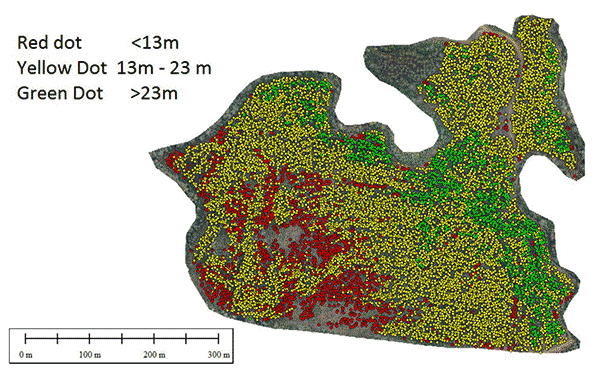
Drones allow you to capture vast amounts of data very efficiently, but for many customers that data only becomes useful to them when analysed and processed to give them the answers they need. That’s where data analytics comes in, which is software to distill gigabytes of raw data to extract the answers you are looking for, and presenting those in a succinct and easily understood manner.
As an example you can see on the right a small section of plantation forestry survey, which has been run through our custom analytics software to count the tree stems and analyse their heights. This allows the client to see at a glance how that area is progressing, whether it could benefit from assistance, or whether they are better off calling in the bulldozers and starting again. It is obviously incredibly valuable information to a forestry company to know now, rather than in 20 years, whether this patch of trees will yield them a good financial return.
Online Data Platforms
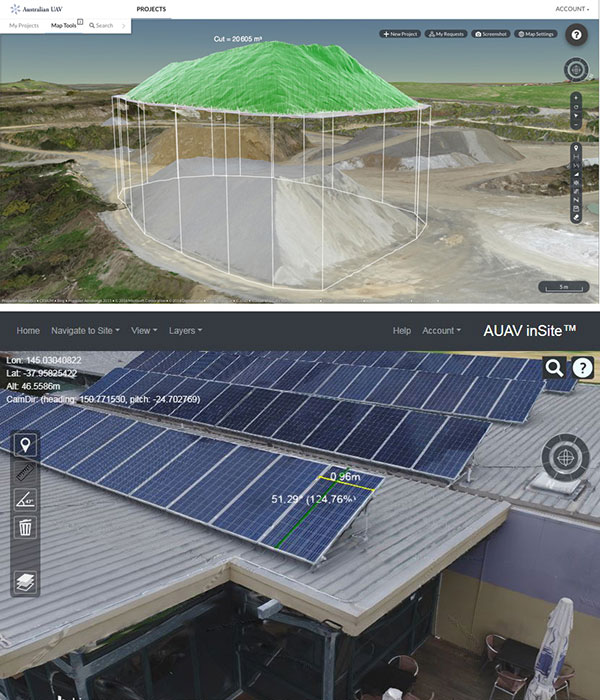
Although some clients will need files they can load into their own CAD or GIS software, many just need to be able to view the data.
In this case an online platform makes the most sense, allowing you to view it all in a very easy and intuitive manner, using just a standard web browser (which in most cases is even compatible with your mobile devices). This not only simplifies viewing, but opens this highly-valuable data up to a much wider audience. For example instead of just the surveyors and GIS team being able to see a site and take measurements, upper management and any stakeholders granted access can do it just as easily.
There is now a wide variety of online platforms available, with some being for general use while others are specific to particular assets (e.g. solar farms) or use in certain industries (e.g agriculture). At AUAV we aren’t tied to any one platform, but can recommend the best option for each client’s individual needs.
On the right you can see a stockpile calculation in the excellent platform from Propeller, which is well-suited for mines, quarries and earthworks. And underneath you can see rooftop solar panels being measured in AUAV’s own online data platform inSite, which is currently in development to assist with managing assets in a more visual manner with full 3D reality meshes.
